-
1.
Experiment. Prototype. Build.
“I learned so much more by building my own project.”
Jun Yan -
2.
Stay on the cutting-edge.
“The program resources are badass!”
Adrian Kuhn -
3.
Share knowledge with other experts.
“The group collaboration was really powerful.”
Caron Zhang -
4.
Add more value to your team.
“I came back to work with code and a product to show. It was very impressive to my manager!”
Nicole Romano
Visualization Lab
Prerequisites
- You are a data science or engineering professional on a data-driven team
- You have some experience coding in Python, R, or JavaScript
- Great data visualizations will have a positive impact on your work
What you will learn
- Learn industry best practices for communicating your data most effectively
- Transform complex ideas into accessible graphics
- Case studies on good vs poor visualization designs
- Tell compelling data stories
- Explore your data faster using visualizations
- Lattice plots, feature histograms, correlation matrices, PCA
- Examples for exploratory data analysis using ggplot2, matplotlib, and seaborn
- Build static visualizations
- Bar, scatter, histogram, sparklines, small multiples, maps, timeseries
- Tutorials using d3.js, nvd3.js, seaborn, bokeh, ggplot2
- Build interactive visualizations
- Filter, pan, zoom, select, maps, networks, tooltips
- Tutorials using d3.js, topojson.js, dc.js, crossfilter.js, leaflet.js, nvd3.js, rCharts, mpld3, bokeh
- Build your own project
- Experiment on data with new visualization tools
- Prototype visualization designs
- Build personal or work-related projects
Each Lab is limited to just 20 participants.
Join now to avoid missing out.
Includes
- Hands-on, project based learning
- Individual support and feedback from industry experts
- Technical tutorials
- Online resources available after the program
- Lightning talks
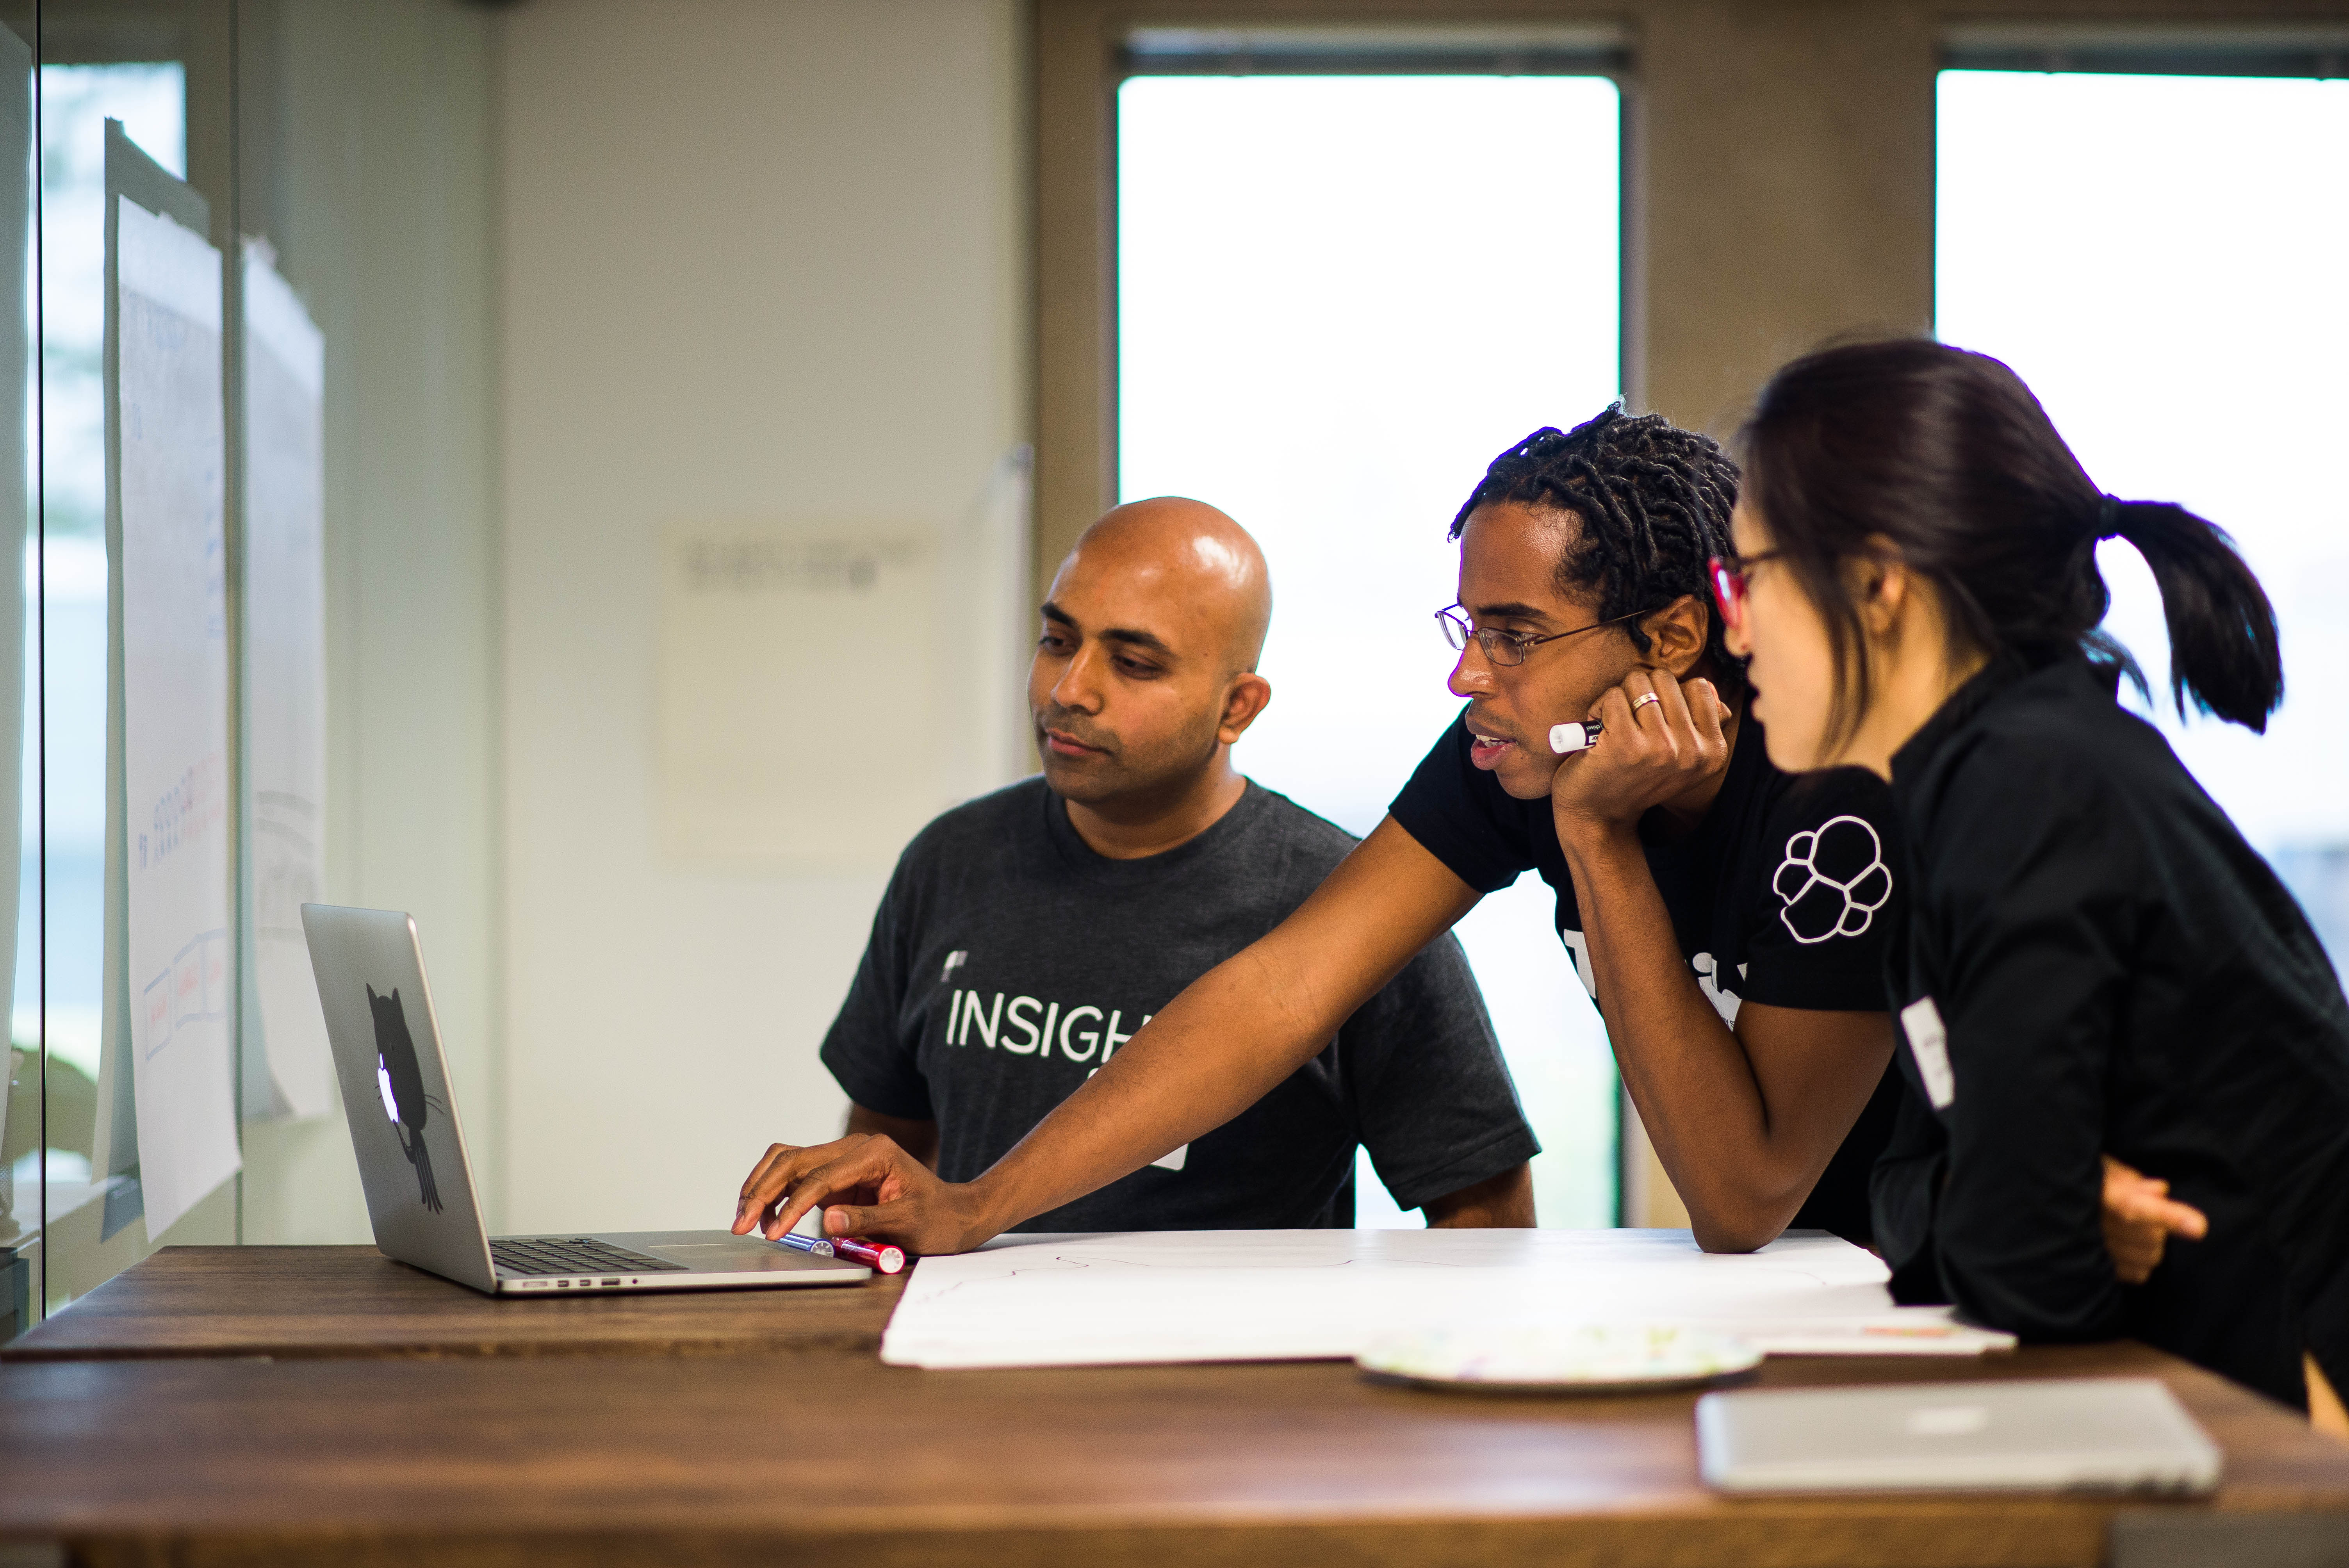
- Learn from other data professionals in a collaborative environment
- Lunches and dinners provided
- Grow your network within the data community
Upcoming
Want to be notified of future dates?
Data Labs Mentors and Speakers come from top companies including:


Spark Lab
Prerequisites
- You are a data science or engineering professional on a data-driven team
- You have some experience coding in Python
- You have a desire to work with data at a massive scale
What you will learn
- Understand the Spark framework
- Resilient Distributed Datasets (RDDs)
- Transformations and Actions
- Jobs, Stages, and Tasks
- Local mode vs Standalone mode
- DataFrames
- SparkSQL
- MLlib
- Learn how to monitor your Spark configurations and jobs
- Configure Master, Worker, Num Cores, Executor and Driver Memory
- Explore and monitor Jobs, Stages, Tasks, Executors, and Storage in the Spark Application UI
- Tune your Spark jobs
- Persisting and Caching RDDs
- Parallelism
- Reduce Shuffling
- Broadcast Variables
- Build your own Ad hoc Spark Jobs in Jupyter Notebook
- Work with existing large datasets
- Dissect and understand your own Spark jobs
- Visualize large datasets
- Build your own project on a Spark cluster
Each Lab is limited to just 20 participants.
Join now to avoid missing out.
Includes
- Hands-on, project based learning
- Individual support and feedback from industry experts
- Technical tutorials
- Online resources available after the program
- Lightning talks
- Learn from other data professionals in a collaborative environment
- Lunches and dinners provided
- Grow your network within the data community
Upcoming
Want to be notified of future dates?
Data Labs Mentors and Speakers come from top companies including:
The Latest from Insight Data Labs
-

Visualizing Machine Learning Thresholds
October 9, 2015
-

Spinning up an Apache Spark Cluster: Step-by-Step
October 5, 2015
-
Data Labs: professional workshops in data
September 30, 2015
“An elite program”


Don’t miss out on future workshops.
Stay up-to-date with Data Labs.